
Tuesday, November 29, 2011
Finding the Area of a Region Between Two Curves
Here is an example of finding an area between two curves without integrating:

Monday, November 28, 2011
Polar Integration
In class today, we derived a formula to find the area bounded by a polar graph by tweaking our method of computing the integral under a curve in rectangular coordinates. Instead of using rectangles and finding the Riemann sum, we used sectors, and eventually got:
A = 
The usage of sectors is preferred in the polar coordinate system simply because it is more convenient. We graph polar equations based on circles and angles, whereas in the rectangular system, we use rectangles and defined horizontal and lateral units.
A point to keep in mind:
- Note how we have to square the polar function (r) before we integrate. This often results in squaring sine or cosine, which are inconvenient functions to integrate. Luckily, we have trig identities.
cos 2x = cos2 x - sin2 x
cos 2x = 1 - 2sin2 x
cos 2x = 2cos2 x - 1
The first identity won't be used as much, as it contains both cosine and sine. The second and third identities have sin2 x and cos2 x isolated with cos(2x). Do a little algebra and you get:
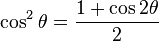
and

These identities are useful simply because integrating cos(2x) is a lot easier than cos2 x and sin2 x.
Happy integrating!
Polar Graphs Using Geogebra
On November 24th, we had a worksheet where we investigated the consequences of changing the parameters in a few basic polar equations (such as r = a sin Θ). Mr. Honner showed us these polar graphs in Geogebra and I'm going to show the "evolution" of Limacons when the parameters are changed in Geogebra also.
Limacons (r = a + b cos Θ):


Limacons (r = a + b cos Θ):


As I played around with Geogebra, I found out a few things:
As the ratio of a/b increases, the polar graph looks more circular.
- First polar graph: the polar graph has a loop inside itself. The ratio of a/b is 1/2.
- Second polar graph: the polar graph makes a heart shape; there is no loop. The ratio of a/b here is 1.
- Third polar graph: the graph here is getting more circular. The ratio of a/b is 1.33.
- Fourth polar graph: the graph is getting even more circular. The ratio of a/b is 4.
Perhaps we can state it in more general terms:
When a/b is between 0 and 1, the graph will have a loop.
When a/b is 1, the graph will make a "heart."
When a/b is between 1 and 2, the graph will be slightly more circular and have a little "dent."
When a/b is greater than or equal to 2, the graph will be nearly circular.
Subscribe to:
Posts (Atom)